

You open the chain to set up an iron condor, you want your short strikes outside the expected move, and then you realize you are not sure which expected move you mean. Add the two at-the-money options together? Multiply by something? Run the implied volatility formula? Three traders will hand you three different numbers and all three will call it the expected move.
They are not wrong. They are answering different questions and using the same name for the answer. Here is what each one is actually measuring, and which one belongs on your chart when you are picking strikes.
What the number is trying to tell you
The expected move is the market's pricing of how far a stock travels by a certain date. It is not a forecast of direction and it is not a guarantee. It is the option market saying, given what people are paying for volatility right now, here is the range the stock is likely to stay inside.
Every version of the calculation pulls from the same input, implied volatility, just packaged differently. IV is already baked into every option price on the chain, so the move is sitting there in the premiums whether or not your platform prints it for you.
A confession first, since it shaped how I think about this. I moved my trading off tastytrade and onto IBKR Desktop a little while back. Tastytrade printed the expected move for you, right on the chain, no work required. IBKR does not, and for the first few weeks that was the feature I missed most. Then I noticed what doing the math by hand actually does to me. It slows me down. Every time I want the number I have to stop, find the at-the-money row, and work it out myself, and that little bit of friction has talked me out of more than one trade I had not really thought through. So I will take the trade off. Convenience is nice. A built-in pause before I commit capital turned out to be worth more.
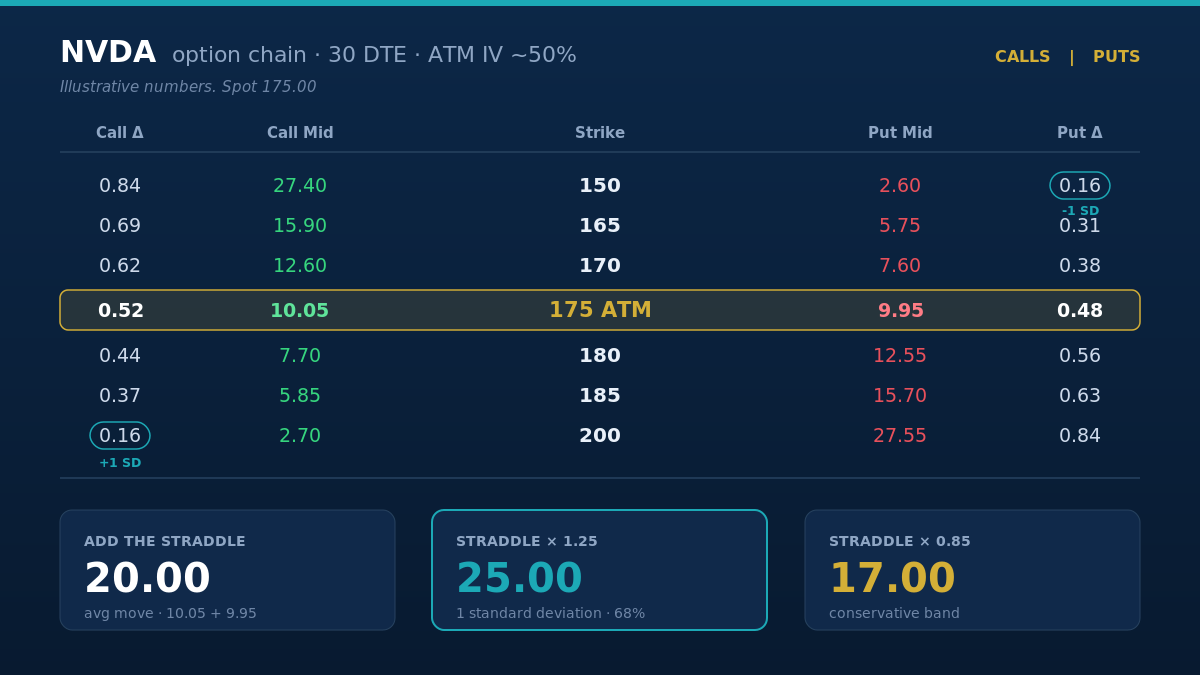
Let me run one name the whole way through. NVDA at 175, the monthly expiration 30 days out, at-the-money implied volatility right around 50 percent. Illustrative numbers, clean enough to follow the math. That is the chain above.
Method one: add up the straddle
The fast way, the one most traders eyeball in two seconds. Take the at-the-money call and the at-the-money put for your expiration, add the two mid prices, and that sum is your expected move.
On the NVDA chain the 175 call is trading 10.05 and the 175 put 9.95. Add them and the straddle is 20.00. So the market is pricing roughly a 20-point move over those 30 days, in either direction. Spot at 175 gives you a band of about 155 to 195.
That is it. No formula, no square roots. The straddle already contains the implied volatility, the days to expiration, and the price of the stock, because all of that is what the options are priced on in the first place. This is the number I reach for first. You can read it straight off the chain in the time it takes to find the at-the-money row.
Method two: the implied volatility formula
The textbook version. The one standard deviation move equals the stock price times implied volatility times the square root of days to expiration over 365.
Plug in NVDA: 175 × 0.50 × √(30 / 365) = 175 × 0.50 × 0.2867 = 25.09.
So this method says about 25 points, a band of roughly 150 to 200. That is the one standard deviation range, the zone the stock has about a 68 percent chance of finishing inside, assuming a normal distribution of returns (which is itself an assumption, not a law).
Now look at what just happened. The straddle gave you 20. The formula gave you 25. Same stock, same expiration, same implied volatility, five points apart. This is where most explanations get sloppy and pick one without telling you why the other is different.
Why they disagree, and where 1.25 comes from
The gap is not an error. It is built into the math.
An at-the-money straddle, under Black-Scholes, prices out to about 0.8 times a one standard deviation move. Not equal to it, about four-fifths of it. The exact factor is 1 over the square root of 2 pi, doubled, which lands at 0.798. Call it 0.8.
So the straddle (20) is roughly 0.8 of the one standard deviation move (25). Flip that around and you get the multiplier people throw around without context:
Because 1 divided by 0.8 is 1.25. The straddle times 1.25 is 20 × 1.25 = 25, which is the formula answer. The two methods agree completely once you know the conversion factor between them. The straddle is the smaller number, the one standard deviation band is the larger number, and 1.25 is the bridge.
So when someone asks whether the expected move is "just the straddle" or "the straddle times 1.25," the honest answer is that those are two different measurements, both legitimate, both useful, and the only mistake is using one and thinking you have the other.
Then where does 0.85 come from
Here is where it gets genuinely contested, because tastytrade taught a generation of traders a rule that points the opposite direction:
That gives 20 × 0.85 = 17. Smaller than the straddle, not larger. If the straddle is 0.8 of a standard deviation and 0.85 of the straddle is even less than that, then this number is nowhere near the one standard deviation band. So what is it?
It is a conservative band, and the reasoning behind it is worth understanding even if you never use the exact figure. Implied volatility runs richer than what the stock usually delivers. Option sellers price in a premium for the risk they are taking, so the implied move tends to overstate the move the stock actually makes, on average, over many cycles. The 0.85 haircut is an attempt to shrink the implied range toward the realized one. It is not the textbook standard deviation. It is a "what tends to actually happen" estimate, tuned by people who sell premium for a living and watched the implied number print too wide more often than too narrow.
Tastytrade also published a more refined version that smooths across the skew instead of leaning on a single strike:
On the chain, the first strangle out (180 call plus 170 put) runs about 15.30 and the second (185 call plus 165 put) about 11.60. Weight them: 0.6(20.00) + 0.3(15.30) + 0.1(11.60) = 12.00 + 4.59 + 1.16 = 17.75. It lands right next to the 0.85 number, which is the point. Both are deliberately tighter than the raw straddle.
So what is the true expected move
This is the part nobody settles, because the word "expected" is doing two jobs.
In plain statistics, the expected value of something is its average. The expected absolute move, the average-sized move the stock makes, works out to about 0.8 of a standard deviation. That is the straddle. The straddle is, almost exactly, the true expected move in the literal sense: the average distance the stock travels. Twenty points.
The one standard deviation band is a different statistic. It is not the average move, it is the width of the range that holds the stock 68 percent of the time. That is the 25, the straddle times 1.25.
The straddle is the expected move if you mean the average move. The 1.25 version is the expected move if you mean the one standard deviation range. The 0.85 version is neither. Three numbers, three questions, one overloaded word.
So both camps are telling the truth and talking past each other. The 0.85 version is a realized-move estimate that survives contact with the market a little better than the implied one does. Pick the number that answers the question you are actually asking.
Reading it off an IBKR chain
Since IBKR Desktop will not hand you the number, you build it from the chain.
Pull up the option chain for your expiration. Find the strike nearest the current price, that is your at-the-money row. Take the call mid and the put mid at that strike and add them. That is your straddle, your average-move estimate, in one step. Want the one standard deviation band instead, multiply by 1.25. Want the conservative band, take 85 percent of it. Same chain, all three numbers in under a minute.
There is a shortcut hiding in the delta column too. The roughly 16-delta call and the roughly 16-delta put sit, by definition, near the edges of the one standard deviation range, because 16 percent in each tail leaves 68 percent in the middle. On the NVDA chain those are close to the 200 call and the 150 put, the same 150-to-200 band the formula gave me, marked on the chain above. If you only want the standard deviation strikes for an iron condor, you can find them by delta without doing any arithmetic at all. Add an Implied Vol column to the chain view in IBKR Desktop if you want to sanity-check the IV the whole thing is built on.
How I actually use it
I do not treat any of these as a line the stock cannot cross. Plenty of names blow through their expected move, that is exactly why selling premium pays anything. I use the expected move to size a position and place strikes, not as a fence the price is forbidden to climb.
For an iron condor or a credit spread, I want my short strikes at or outside the one standard deviation band, so the 25-point version is the one I care about, and I find it fastest through the 16-delta strikes. When I am thinking about how much a position can realistically move against me before I manage it, I go back to the straddle, the average-move number, because most moves are average moves, not standard deviation moves. The 0.85 band is my gut check, the reminder that the implied number is usually a little fat and the stock often does less than the chain is charging for.
Knowing which number you are holding is the whole game. A condor built off the average-move band is a tighter, more aggressive trade than you think you put on, because you reached for the standard deviation range and grabbed the straddle by mistake. I have made that exact mistake. Read the chain, name the number, then pick the strikes.